Refer to the figure.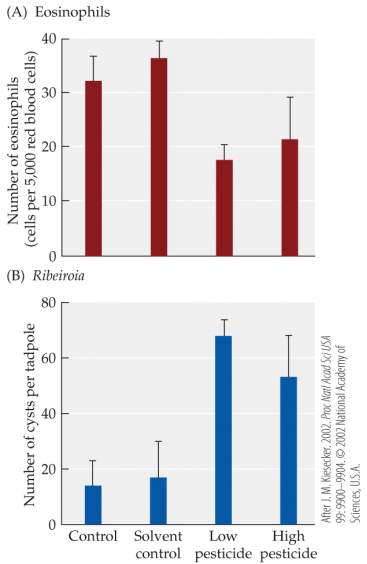
-The figure is based on studies of the effects of pesticides on the tadpole immune system. In a laboratory experiment, wood frog (Rana sylvatica) tadpoles were exposed to low or high concentrations of a pesticide, and then Ribeiroia parasites. The tadpoles were then examined for (A) numbers of eosinophils and (B) numbers of Ribeiroia cysts. Error bars show one SE of the mean. Which statement is supported by the evidence shown in the figure?
A) Tadpoles exposed to high levels of pesticides had more cysts per tadpole than those exposed to low levels of pesticides.
B) Tadpoles exposed to pesticides had fewer eosinophils than those not exposed to pesticides.
C) The number of cysts per tadpole was similar in the solvent control and low pesticide groups.
D) Pesticides decreased eosinophils more when tadpoles were exposed to high concentrations of pesticides than when they were exposed to low concentrations.
Correct Answer:
Verified
Q6: In addition to the frogs themselves, which

