Refer to the figure.
 This figure is based on data from a study of how ambient temperature during development affects adult body size. The figure shows data for individuals of a single genotype in a single species. A total of 20 individuals were raised under different temperature treatments.
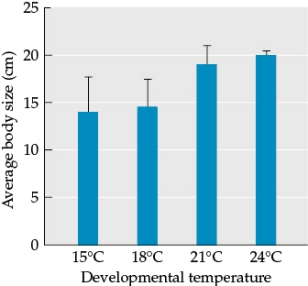
-The blue bars show the average body size of individuals for each temperature treatment, and the black bars provide a measure of the variation in body size recorded for each treatment. Which developmental temperature led to the highest variability in offspring size? Which temperature led to the lowest variability in offspring size? How did you assess the effect of temperature on body size variation? What is the term that best describes this pattern?
Correct Answer:
Verified
View Answer
Unlock this answer now
Get Access to more Verified Answers free of charge
Q40: According to Grime, under conditions of low
Q41: Which classification scheme or metric is generally
Q42: Suppose that the average adult life span
Q43: Sequential hermaphroditism and paedomorphic development are both
Q44: Which statement about clownfish is false?
A) Clownfish

