Using the following table, construct a scatter plot of the pairs of values for height and weight. Calculate the correlation between height and weight. 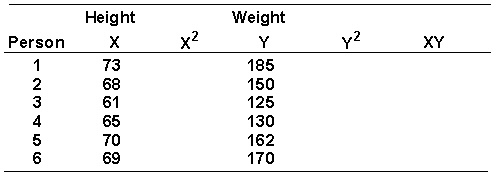
Correct Answer:
Verified
Q129: Given the following set of data for
Q130: Given the following set of data for
Q131: Define Y intercept.
Q132: The phone rings and the President is
Q133: Calculate the Pearson r for the following
Q135: What factors influence the choice of whether
Q136: An ornithologist wants to know how much
Q137: Define variability accounted for by X.
Q138: If the N is small, can an
Q139: Why are z scores used, instead of
Unlock this Answer For Free Now!
View this answer and more for free by performing one of the following actions

Scan the QR code to install the App and get 2 free unlocks

Unlock quizzes for free by uploading documents