Multiple Choice
A beanstalk grows at a constant rate. The beanstalk s height (inches) as a function of time (days) is modeled by  . Which of the following graphs illustrate the function h ?
A) 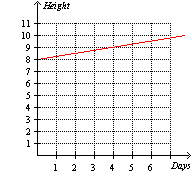
B) 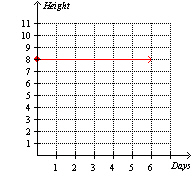
C) 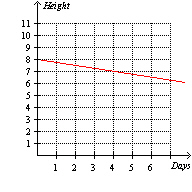
D) 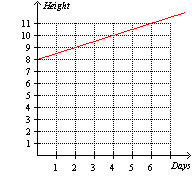
E) None of these options
Correct Answer:
Verified
Related Questions
Q33: Using the following table of values, determine
Q34: For the linear equation Q35: Using the following table of values, determine Q36: Using the following graph, find the slope Q37: The distance d of a car traveling Unlock this Answer For Free Now! View this answer and more for free by performing one of the following actions Scan the QR code to install the App and get 2 free unlocks Unlock quizzes for free by uploading documents![]()

