Multiple Choice
A population of rabbits was tracked over a 55-day period. The data is shown in the following graph. What was the maximum number of rabbits during this time period? 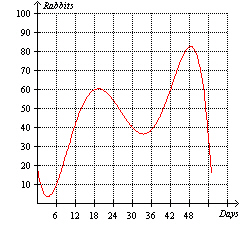
A) 61
B) 49
C) 38
D) 15
E) 83
Correct Answer:
Verified
Related Questions
Q39: The number of gallons of water remaining
Q40: Using the table below, determine the value
Q41: Which one of the following graphs represent
Q42: A ball is thrown straight upward from
Q43: Given the table below, find the net
Q45: Consider the function f(x) = 4 x

Unlock this Answer For Free Now!
View this answer and more for free by performing one of the following actions

Scan the QR code to install the App and get 2 free unlocks

Unlock quizzes for free by uploading documents