The following table shows the values of airfare for a roundtrip ticket from San Antonio, TX to Portland, OR.
Which one of the following scatterplots illustrates this data?
A) 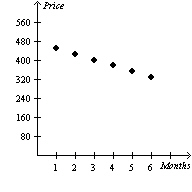
B) 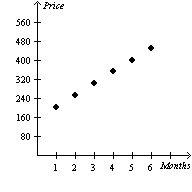
C) 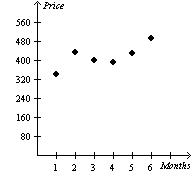
D) None of these options.
E) 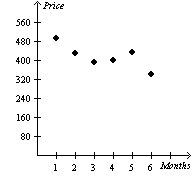
Correct Answer:
Verified
Q21: Find the input(s) corresponding to the output
Q22: Find the output(s) corresponding to the input
Q23: The cost for a cell phone plan
Q24: For the scatter plot below, which statement
Q25: Using the table below, determine the value
Q27: The number of gallons of water remaining
Q28: The number of gallons of water remaining
Q29: Which one of the following models the
Q30: Find the domain and range of the
Q31: The table below describes the average temperatures
Unlock this Answer For Free Now!
View this answer and more for free by performing one of the following actions

Scan the QR code to install the App and get 2 free unlocks

Unlock quizzes for free by uploading documents