The graph shows the average monthly high temperature in Newark NJ for months from November to April. Does the data graphed follow a linear pattern a parabolic pattern or neither? 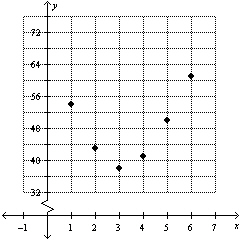
A) linear
B) parabolic
C) neither
Correct Answer:
Verified
Q52: You are given a quadratic model
Q53: You are given a quadratic model
Q54: The average profit in dollars A that
Q55: A quadratic model for the median price
Q56: Given the data set draw a scatterplot.
Q58: A _ model fits data points that
Q59: Given the data set draw a scatterplot.
Q60: The average profit in dollars A that
Q61: If a quadratic model Q62: You have moved to Chicago in the![]()
Unlock this Answer For Free Now!
View this answer and more for free by performing one of the following actions

Scan the QR code to install the App and get 2 free unlocks

Unlock quizzes for free by uploading documents