A lake is initially stocked with 500 turtles and the turtle population is sampled at 8-week intervals to estimate the population size. The table illustrates the data gathered from the sampling.
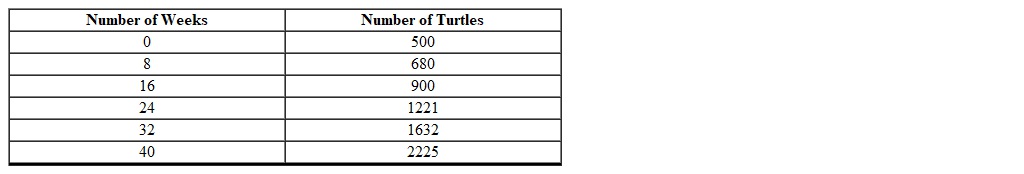 Using a graphing calculator find an appropriate curve that models the turtle population as a function of the number of weeks (round to the nearest thousandth).
Correct Answer:
Verified
Q100: What type of function does the data
Q101: Is the graph of the equation linear
Q102: When you graph a an ordered pair
Q103: When you graph a set of points
Q104: A graph of the equation 
Q106: The revenue of a company is being
Q107: A graph of the equation
Q108: When you graph on the coordinate plane
Q109: After college graduation Sheena was offered two
Q110: Which one of the following functions is
Unlock this Answer For Free Now!
View this answer and more for free by performing one of the following actions

Scan the QR code to install the App and get 2 free unlocks

Unlock quizzes for free by uploading documents