For the scatter plot below which statement describes the relationship between the variables? 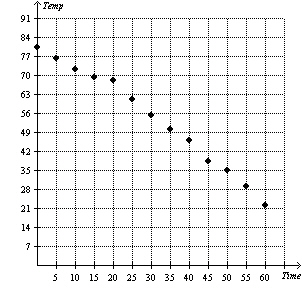
A) As the time increases the temperature increases.
B) As the time increases the temperature decreases.
C) As the time decreases the temperature stays constant.
D) There is no relationship between the variables.
E) As the time decreases the temperature decreases.
Correct Answer:
Verified
Q32: Using the table below determine the value
Q33: Find the domain and range of the
Q34: The value V of a historic vehicle
Q35: Given the data below how can you
Q36: The mass of bacteria (in micrograms) in
Q38: The table below describes the average temperatures
Q39: The number of gallons of water remaining
Q40: The mass of bacteria (in micrograms) in
Q41: The distance d (in miles) that a
Q42: The temperature (in ° F) of a
Unlock this Answer For Free Now!
View this answer and more for free by performing one of the following actions

Scan the QR code to install the App and get 2 free unlocks

Unlock quizzes for free by uploading documents