The illumination of a light bulb is targeted at 1,170 lumens. The standard deviation is ±16.6 A technician randomly selects 15 bulbs per hour and records the mean illumination each hour. Determine the most accurate mean control chart drawn from the data shown in the table.
Hour
Illumination
1
1,145
2
1,156
3
1,141
4
1,183
5
1,180
6
1,180
Hour
Illumination
7
1,177
8
1,191
9
1,193
10
1,188
11
1,172
12
1,171
Hour
Illumination
13
1,179
14
1,161
15
1,159
16
1,173
17
1,190
18
1,143
Hour
Illumination
19
1,181
20
1,187
21
1,191
22
1,144
23
1,158
24
1,181
Hour
Illumination
25
1,192
26
1,191
27
1,165
28
1,181
29
1,168
30
1,195
A) 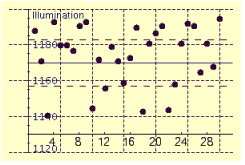
B) 
C) 
D) 
Correct Answer:
Verified
Q183: Find the sample standard deviation from
Q184: The depth of a silicon wafer
Q185: Find the sample standard deviation from
Q186: A sporting goods manufacturer makes baseballs.
Q187: Find the sample standard deviation from
Q189: Find the sample standard deviation from
Q190: Find the sample standard deviation from
Q191: Find the sample standard deviation from
Q192: Find the sample standard deviation from
Q193: Find the sample standard deviation from
Unlock this Answer For Free Now!
View this answer and more for free by performing one of the following actions

Scan the QR code to install the App and get 2 free unlocks

Unlock quizzes for free by uploading documents