A certain manufacturing process has a target value of 1.20 cm and a standard deviation of ±0.15 cm A sample of nine measurements is made each hour as follows. Draw a mean control chart using data from the table above.
A) 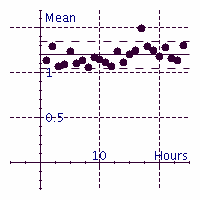
B) 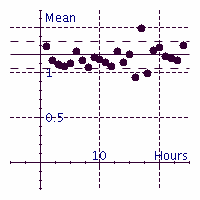
C) 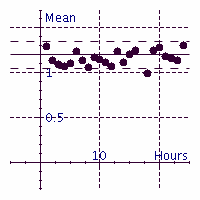
D) 
Correct Answer:
Verified
Q191: Find the sample standard deviation from
Q192: Find the sample standard deviation from
Q193: Find the sample standard deviation from
Q194: Find the sample standard deviation from
Q195: Find the sample standard deviation from
Q197: Find the sample standard deviation from
Q198: The mileage on six vehicles leased
Q199: Find the sample standard deviation from
Q200: Find the sample standard deviation from
Q201: The target load weight for a
Unlock this Answer For Free Now!
View this answer and more for free by performing one of the following actions

Scan the QR code to install the App and get 2 free unlocks

Unlock quizzes for free by uploading documents