Multiple Choice
An inspector recorded the number of faulty calculators and the hour in which they passed by his station, as shown in the table below. Draw a line graph for these data.
A) 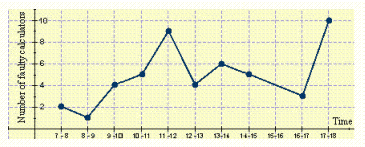
B) 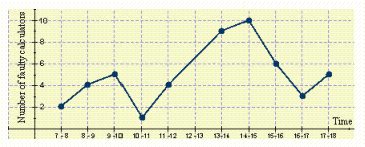
C) 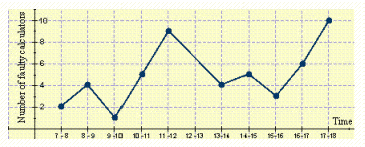
D) 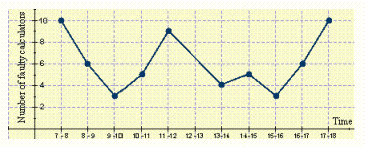
E) 
Correct Answer:
Verified
Related Questions
Q110: Q111: An industrial technician must keep a Q112: From the following grouped data, find Q113: Use the figure below to answer the Unlock this Answer For Free Now! View this answer and more for free by performing one of the following actions Scan the QR code to install the App and get 2 free unlocks Unlock quizzes for free by uploading documents![]()

