Multiple Choice
Which of the following illustrations represents a circle graph?
A) 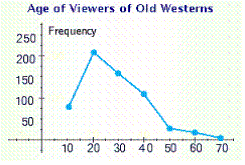
B) 
C) 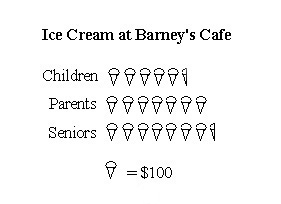
D) 
E) 
Correct Answer:
Verified
Related Questions
Q2: To the nearest two million, how many
Q5: Find the mean of the list of
Q8: Use the data in the table
Q9: Which of the following illustrations is a
Q10: Refer to the pie graph that shows
Q11: Which of the following illustrations is a
Q12: Which of the following illustrations best represents
Q15: Match the type of information with the
Q16: Refer to the pictograph.
How much more money
Q18: Refer to the line graph.
In approximately what
Unlock this Answer For Free Now!
View this answer and more for free by performing one of the following actions

Scan the QR code to install the App and get 2 free unlocks

Unlock quizzes for free by uploading documents