Multiple Choice
In the graph below, name the linear inequality in two variables that is represented by the shaded region. 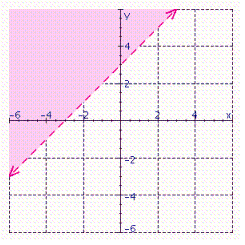
A) 
B) 
C) 
D) 
E) 
Correct Answer:
Verified
Related Questions
Q101: Graph the solution set. Q102: Graph the inequality. Q103: Graph the solution set. Q104: You have two cars. The first car Q105: Graph the inequality. Q107: In the graph below, name the linear![]()
![]()
![]()
![]()

