Multiple Choice
Which of the following illustrations represents a circle graph?
A) 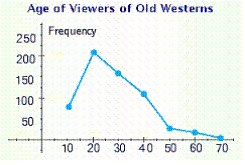
B) 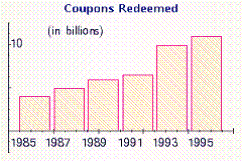
C) 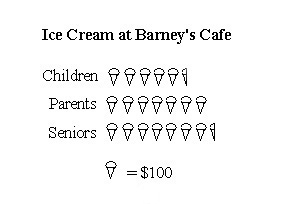
D) 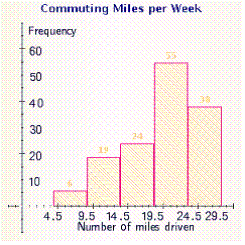
E) 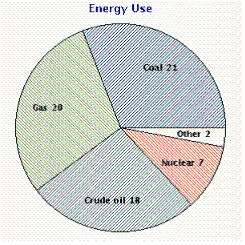
Correct Answer:
Verified
Related Questions
Q8: Refer to the line graph.
At what times
Q9: Match the type of information with the
Q10: Refer to the pie graph that shows
Q11: Refer to the pictograph.
How much more money
Q12: Refer to the line graph.
In approximately what
Q14: Use the data in the table
Q15: Use the data in the table
Q16: Which of the following illustrations best represents
Q17: Balls numbered from 1 to 38
Q18: Which of the following illustrations is a
Unlock this Answer For Free Now!
View this answer and more for free by performing one of the following actions

Scan the QR code to install the App and get 2 free unlocks

Unlock quizzes for free by uploading documents