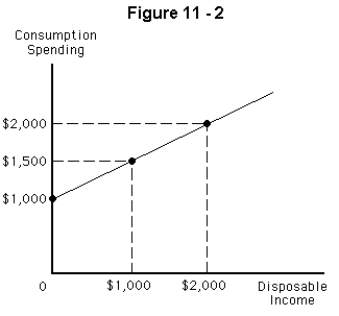
-Refer to Figure 11-2.Use the graph to determine the marginal propensity to consume.
A) 0.50
B) 0.60
C) 0.75
D) 0.80
E) 0.90
Correct Answer:
Verified
Q31: Use the table below to determine the
Q32: Q33: Which of the following is the definition Q34: Use the table below to determine the Q35: Which of the following would lead to Q37: Use the table below to find the Q38: Which of the following statements is most Q39: The consumption function Q40: If the marginal propensity to consume is Q41: If real disposable income increased by $10,000![]()
A) illustrates the relationship between
Unlock this Answer For Free Now!
View this answer and more for free by performing one of the following actions

Scan the QR code to install the App and get 2 free unlocks

Unlock quizzes for free by uploading documents