Multiple Choice
Figure 10-18 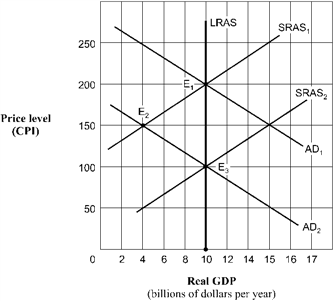 Given the shift of the aggregate demand curve from AD1 to AD2 in Figure 10-18, the real GDP and price level (CPI) in long-run equilibrium will be
A) $10 billion and 200.
B) $4 billion and 150.
C) $10 billion and 150.
D) $10 billion and 100.
Correct Answer:
Verified
Related Questions
Q173: Which of the following will most likely
Q174: Figure 10-18 Q175: Use the figure below to answer the Q176: Which of the following would be most Q177: Figure 10-18 Q179: Use the figure below to answer the Unlock this Answer For Free Now! View this answer and more for free by performing one of the following actions Scan the QR code to install the App and get 2 free unlocks Unlock quizzes for free by uploading documents![]()
![]()

