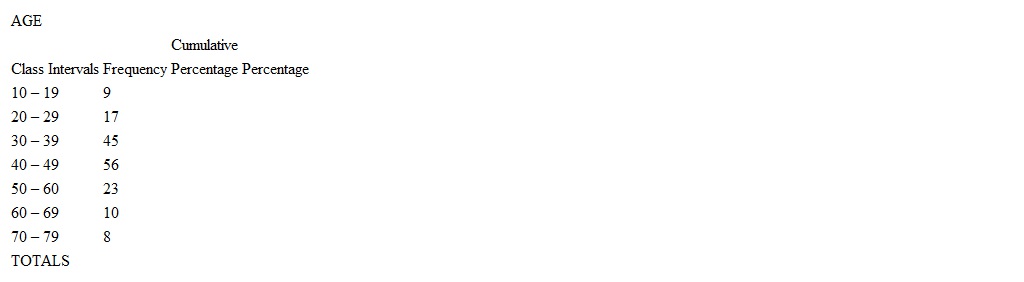
The frequency distribution below displays the distribution of age for a sample drawn from a community. Finish the table by completing the columns for percentages, and cumulative percentages.
Correct Answer:
Verified
Q19: If 60 cases range in score from
Q20: When constructing frequency distributions for variables measured
Q21: For a single variable measured at the
Q22: The graphical presentation method that uses midpoints
Q23: Forty of every two hundred students attend
Q24: Histograms and line charts or frequency polygons
Q26: You are the Dean of students at
Q27: A researcher wants to visually display the
Q28: For a single variable at the interval-ratio
Q29: Twenty-three of the 50 states rejected a
Unlock this Answer For Free Now!
View this answer and more for free by performing one of the following actions

Scan the QR code to install the App and get 2 free unlocks

Unlock quizzes for free by uploading documents