Exhibit 1A-10 Multi-curve graph 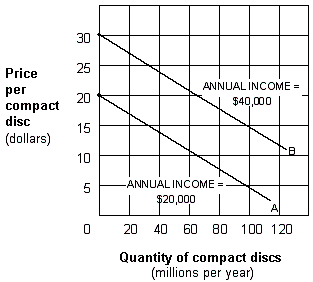
Exhibit 1A-10 represents a three-variable relationship. As the annual income of consumers rises from $20,000 (line A) to $40,000 (line B) , the result is a:
A) rightward movement along each curve.
B) leftward movement along each curve.
C) leftward shift from curve B to curve A.
D) rightward shift from curve A to curve B.
Correct Answer:
Verified
Q19: Scarcity:
A) is a problem only in industrialized
Q30: Exhibit 1A-1 Straight line Q31: Exhibit 1A-5 Straight line Q33: Exhibit 1A-7 Straight line relationship Q34: Exhibit 1A-8 Straight line relationship Q36: When economists say scarcity, they mean: Q38: Scarcity: Q39: Exhibit 1A-4 Straight line Q40: A shift in a curve represents a Q40: Exhibit 1A-7 Straight line relationship Unlock this Answer For Free Now! View this answer and more for free by performing one of the following actions Scan the QR code to install the App and get 2 free unlocks Unlock quizzes for free by uploading documents![]()
![]()

A) there
A) exists because resources are unlimited while![]()

