The change in the single-breath carbon dioxide (CO₂) curve from "A" to "B" shown in the figure may be a result of which of the following?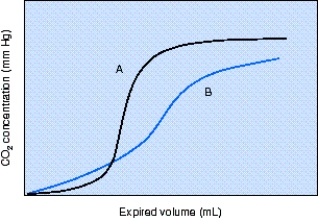
A) Hypervolemia
B) Decreased positive end-expiratory pressure (PEEP)
C) Increased mean airway pressure
D) Excessive bronchodilator administration
Correct Answer:
Verified
Q1: A pulse oximeter differentiates oxyhemoglobin from deoxygenated
Q2: During shift report,the day shift respiratory therapist
Q3: A patient receiving mechanical ventilation is being
Q4: Pulse oximetry is most useful in which
Q5: The respiratory therapist has just stopped postural
Q7: The area under the curve of a
Q8: A pulse oximeter reading will be most
Q9: The capnogram in the figure is indicative
Q10: For a given minute ventilation,partial pressure of
Q11: During which phase of a capnogram does
Unlock this Answer For Free Now!
View this answer and more for free by performing one of the following actions

Scan the QR code to install the App and get 2 free unlocks

Unlock quizzes for free by uploading documents