In this graph we can see that there is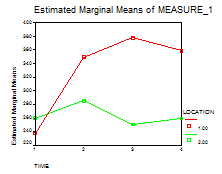
A) a significant difference between Location 1 at time 1 and Location 2 at time 1.
B) an interaction between location and time.
C) a significant post hoc analysis.
D) a quadratic significant correlation.
Correct Answer:
Verified
Q55: In the Spilich et al. study of
Q56: When we compute an effect size measure
Q57: In a factorial design involving the sex
Q58: When we say that a measure is
Q59: A factorial analysis of variance involves more
Q61: In analysis of variance, factor refers to
Q62: The mean difference in GPA based on
Q63: Calculate and interpret F for each effect
Q64: Three main effects and three interactions are
Q65: ![]()
Unlock this Answer For Free Now!
View this answer and more for free by performing one of the following actions

Scan the QR code to install the App and get 2 free unlocks

Unlock quizzes for free by uploading documents