The Ventilator Graphics Generated by Mechanical Ventilation with Pressure-Controlled Continuous
The ventilator graphics generated by mechanical ventilation with pressure-controlled continuous mandatory ventilation (PC-CMV) ,rate 18,peak inspiratory pressure (PIP) 25 cm H₂O,positive end-expiratory pressure (PEEP) 5 cm H₂O,are shown in the scalars below.Interpretation of these scalars reveals which of the following?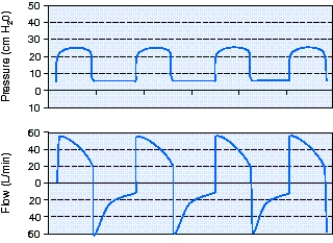
A) The flow rate is set too high and should be reduced.
B) There is air trapping that could be due to a high respiratory rate.
C) The ventilator settings are appropriate and there are no problems.
D) There is a leak in the system that needs to be identified and corrected.
Correct Answer:
Verified
Q6: What is the trigger variable for the
Q7: A patient is receiving full ventilatory support
Q8: Identify the sinusoidal (or sine)waveform in the
Q9: The type of flow curve produced by
Q10: An inadequate flow setting during volume ventilation
Q12: What is the inspiratory time shown in
Q13: The peak inspiratory flow rate on the
Q14: The most important factor to affect the
Q15: Identify the improperly set ventilator parameter using
Q16: The two waveforms that are common for
Unlock this Answer For Free Now!
View this answer and more for free by performing one of the following actions

Scan the QR code to install the App and get 2 free unlocks

Unlock quizzes for free by uploading documents