Table 8-3
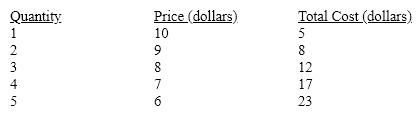 Explain how much the firm shown in Table 8-3 should produce, first using total profit and then using marginal analysis.
Correct Answer:
Verified
View Answer
Unlock this answer now
Get Access to more Verified Answers free of charge
Q221: If your cumulative Grade Point Average (GPA)
Q222: Do firms really seek to maximize profits?
Q223: Why assume that firms maximize profit, when
Q224: Is it a good thing to go
Q225: For a number of years, General Motors
Q226: Define the following terms completely and concisely.
Q227: The total cost of producing one unit
Q227: Assume that you have taken over management
Q229: Why is the total profit curve shaped
Q232: If a firm's fixed cost (overhead) increases,
Unlock this Answer For Free Now!
View this answer and more for free by performing one of the following actions

Scan the QR code to install the App and get 2 free unlocks

Unlock quizzes for free by uploading documents