Figure 8-1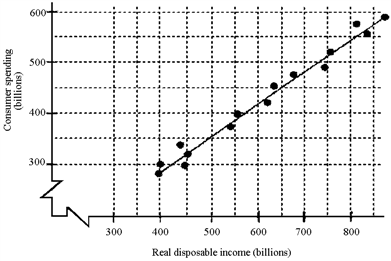
Based on the scatter diagram in Figure 8-1, approximately how much will consumption increase after a permanent tax cut of $400 billion?
A) $100 billion
B) $150 billion
C) $250 billion
D) $350 billion
Correct Answer:
Verified
Q82: Historical data depicted on a scatter diagram
Q84: If an economist wants to make a
Q86: If real disposable income is $300 billion
Q89: The numerical value of the MPC is
Q92: The nation's disposable income increases by $400
Q93: The slope of the scatter diagram representing
Q94: The marginal propensity to consume is
A)disposable income
Q96: Economists expect the relationship between consumption and
Q99: The marginal propensity to consume (MPC) is
Q103: A movement along the consumption function can
Unlock this Answer For Free Now!
View this answer and more for free by performing one of the following actions

Scan the QR code to install the App and get 2 free unlocks

Unlock quizzes for free by uploading documents