Figure 53-5 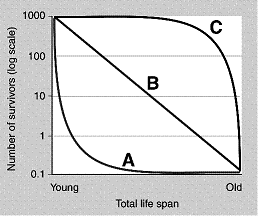 Refer to the accompanying figure. How would the survivorship curve for elephants be represented?
A) The curve A
B) The curve B
C) The curve C
D) Either A or C, depending on the species
E) Elephant populations would be better represented by a curve falling between A and B.
Correct Answer:
Verified
Q21: The growth rate of a population is
Q23: An example of a density-dependent factor that
Q31: Iteroparity is common in which of the
Q32: Which of the following would increase population
Q33: Figure 53-2 Q34: Figure 53-2 Q35: Figure 53-5 Q38: Two members of the same species compete Q39: Figure 53-2 Q41: _ generally have greater population densities than Unlock this Answer For Free Now! View this answer and more for free by performing one of the following actions Scan the QR code to install the App and get 2 free unlocks Unlock quizzes for free by uploading documents![]()
![]()
![]()
![]()

