Figure 53-3 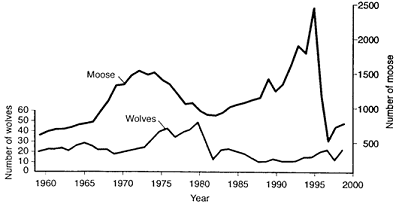 Based on the accompanying figure, the decline in the moose population in 1996 was most likely due to a(n) :
A) predictable increase in the wolf population.
B) unpredictable increase in the wolf population.
C) decrease in the intrinsic rate of increase for the moose population.
D) decline in the food supply.
E) unknown disease organism.
Correct Answer:
Verified
Q5: Which set of values would result in
Q17: Which of the following consists of organisms,
Q18: The logistic equation:
A) models a J-shaped growth
Q20: Clumped dispersion is often influenced by:
A) the
Q21: When the size of a population greatly
Unlock this Answer For Free Now!
View this answer and more for free by performing one of the following actions

Scan the QR code to install the App and get 2 free unlocks

Unlock quizzes for free by uploading documents