Multiple Choice

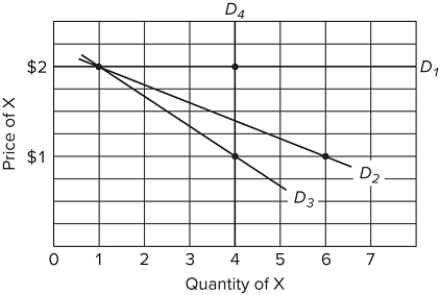 Refer to the table and graph. Suppose that the price of X falls from $2 to $1, while the price of Y remains at $4. Which of the following represents the demand curve for X if the consumer has money income of $10 to spend on X and Y?
A) D₁
B) D₂
C) D₃
D) D₄
Correct Answer:
Verified
Related Questions
Q182: The table shows the marginal-utility schedules for
Q183: Diminishing marginal utility explains why
A)the income effect
Q184: Answer the question on the basis of
Unlock this Answer For Free Now!
View this answer and more for free by performing one of the following actions

Scan the QR code to install the App and get 2 free unlocks

Unlock quizzes for free by uploading documents