Multiple Choice
 Refer to the graph. A decrease in fixed costs is shown by
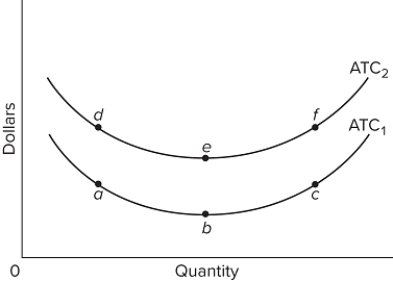
A) a move along short-run average total cost curve ATC₂ from point e to point f.
B) a move along short-run average total cost curve ATC₁ from point a to point b.
C) the shift of the short-run average total cost curve from ATC₁ to ATC₂.
D) the shift of the short-run average total cost curve from ATC₂ to ATC₁.
Correct Answer:
Verified
Related Questions

