The graphs below display the average life expectancy for Americans according to the National
Center for Health Statistics. Which graph would you show if you wanted to convince someone that
the advances of modern medicine will soon have us living to be 150? 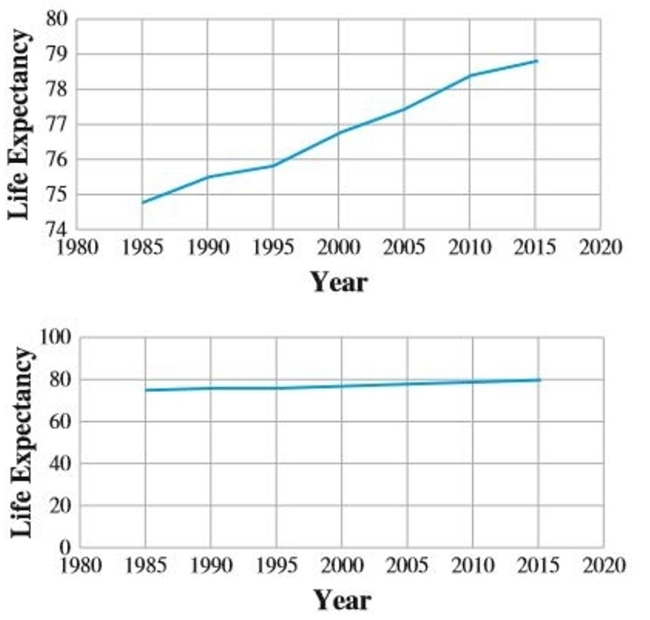
Correct Answer:
Verified
View Answer
Unlock this answer now
Get Access to more Verified Answers free of charge
Q158: Find the equation of the regression line.
Q159: A data set of size 21 has
Q160: Use the equation of the regression line
Q161: For the following data
(a)Draw a scatter plot.
(b)Find
Q162: Draw a bar graph illustrating the change
Q164: Consider the survey question "Are you going
Q165: Consider the survey question "Do you think
Q166: An upcoming school levy in my town
Q167: For the following data
(a)Draw a scatter plot.
(b)Find
Q168: A stats instructor has recorded the scores
Unlock this Answer For Free Now!
View this answer and more for free by performing one of the following actions

Scan the QR code to install the App and get 2 free unlocks

Unlock quizzes for free by uploading documents