Draw a scatter plot and describe the relationship. 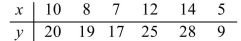
Correct Answer:
Verified
View Answer
Unlock this answer now
Get Access to more Verified Answers free of charge
Q116: Given the following information about test scores,
Q117: Find the area under the normal distribution
Q118: Normal distributions are very commonly used for
Q119: Suppose that the mean sale price for
Q120: According to recent research, the mean height
Q122: Select the graph below that best represents
Q123: Based on data compiled by the World
Q124: Draw a scatter plot for the data
Q125: Draw a scatter plot and describe the
Q126: The average amount customers at a certain
Unlock this Answer For Free Now!
View this answer and more for free by performing one of the following actions

Scan the QR code to install the App and get 2 free unlocks

Unlock quizzes for free by uploading documents