The data below are the number of cattle on farms in the United States (in millions) for each year that
Begins a decade from 1910 to 2010. Draw a box plot for the data below. Are there any outliers? If
So, what are they? 
A) 
B) 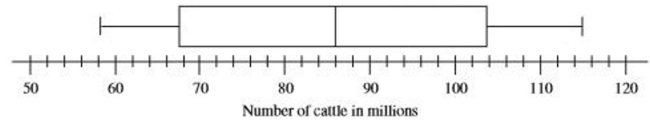
C) 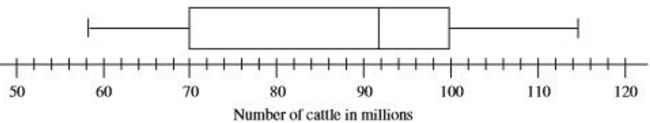
D) 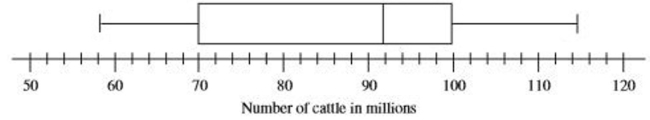
Correct Answer:
Verified
Q102: If a data value has a Z
Q103: Assume a data set is normally distributed
Q104: If a student scored 1,484 on the
Q105: When data are normally distributed, approximately of
Q106: Suppose that you collect a very large
Q108: Assume that the finishing times for a
Q109: Normal distributions are very commonly used for
Q110: Find the area under the normal distribution
Q111: Assume that males have a mean height
Q112: Suppose the mean number of candies in
Unlock this Answer For Free Now!
View this answer and more for free by performing one of the following actions

Scan the QR code to install the App and get 2 free unlocks

Unlock quizzes for free by uploading documents