Solved

Use the REGRESSION Feature on a Graphing Calculator

Question 122

Multiple Choice

Use the REGRESSION feature on a graphing calculator.
-Since 1984 funeral directors have been regulated by the Federal Trade Commission. The average cost of a funeral for an adult in a Midwest city has increased, as shown in the following table. Use the REGRESSION feature on a graphing calculator. -Since 1984 funeral directors have been regulated by the Federal Trade Commission. The average cost of a funeral for an adult in a Midwest city has increased, as shown in the following table.   Let x represent the number of years since 1980. Use a graphing calculator to fit a quartic function to the data. Round Your answer to five decimal places. A)  y = 170.5971x + 1991.5213 B)    C)    D)   Let x represent the number of years since 1980. Use a graphing calculator to fit a quartic function to the data. Round
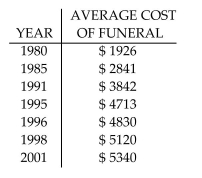
Your answer to five decimal places.


A) y = 170.5971x + 1991.5213
B) Use the REGRESSION feature on a graphing calculator. -Since 1984 funeral directors have been regulated by the Federal Trade Commission. The average cost of a funeral for an adult in a Midwest city has increased, as shown in the following table.   Let x represent the number of years since 1980. Use a graphing calculator to fit a quartic function to the data. Round Your answer to five decimal places. A)  y = 170.5971x + 1991.5213 B)    C)    D)
C) Use the REGRESSION feature on a graphing calculator. -Since 1984 funeral directors have been regulated by the Federal Trade Commission. The average cost of a funeral for an adult in a Midwest city has increased, as shown in the following table.   Let x represent the number of years since 1980. Use a graphing calculator to fit a quartic function to the data. Round Your answer to five decimal places. A)  y = 170.5971x + 1991.5213 B)    C)    D)
D) Use the REGRESSION feature on a graphing calculator. -Since 1984 funeral directors have been regulated by the Federal Trade Commission. The average cost of a funeral for an adult in a Midwest city has increased, as shown in the following table.   Let x represent the number of years since 1980. Use a graphing calculator to fit a quartic function to the data. Round Your answer to five decimal places. A)  y = 170.5971x + 1991.5213 B)    C)    D)

Correct Answer:

verifed

Verified

Unlock this answer now
Get Access to more Verified Answers free of charge

Related Questions

Unlock this Answer For Free Now!

View this answer and more for free by performing one of the following actions

qr-code

Scan the QR code to install the App and get 2 free unlocks

upload documents

Unlock quizzes for free by uploading documents