Solve the problem.
-The graph below shows the total sales of houses in a town from 2000 to 2005. The graph also shows the sale of houses in the summer , S, and in the other times of the year, Y. 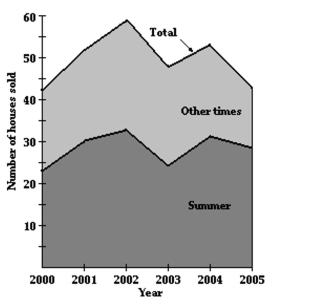 Estimate The number of houses sold in the summer of 2004.
A) 51
B) 36
C) 28
D) 31
Correct Answer:
Verified
Q115: Two points on L1 and two points
Q116: Determine whether the two given lines are
Q117: Determine whether the two given lines are
Q118: Find the requested value. Q119: Two points on L1 and two points Q120: Find the equation of a line with Q121: Solve the problem. Q122: Solve the problem. Q123: Solve the problem. Q125: Solve the problem.
-![]()
-The graph below shows the
-The graph below shows the
-Sue and Bob have each
-The graph below shows the
Unlock this Answer For Free Now!
View this answer and more for free by performing one of the following actions

Scan the QR code to install the App and get 2 free unlocks

Unlock quizzes for free by uploading documents