Solve the problem.
-Sue and Bob have each saved money during every year from 2000 to 2005. The following bar graph shows the amounts saved each of those years. 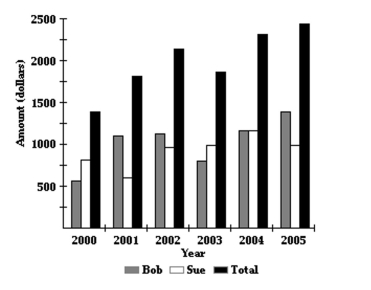 In what years did Bob save more than the previous year, but Sue save less than the previous year?
A) 2001 and 2004
B) 2002 and 2004
C) 2001 and 2005
D) 2004 and 2005
Correct Answer:
Verified
Q109: Determine whether the two given lines are
Q110: Solve the problem. Q111: Use the graph to find the value. Q112: Solve the problem. Q113: Find the requested value. Q115: Two points on L1 and two points Q116: Determine whether the two given lines are Q117: Determine whether the two given lines are Q118: Find the requested value. Q119: Two points on L1 and two points Unlock this Answer For Free Now! View this answer and more for free by performing one of the following actions Scan the QR code to install the App and get 2 free unlocks Unlock quizzes for free by uploading documents
-![]()
-The following graph shows the
-![]()
-![]()

