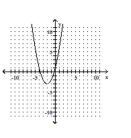
Determine whether the graph illustrated represents a function. Give the domain and range of the relation or function.
-
A) 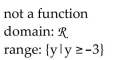
B) 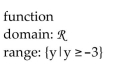
C) 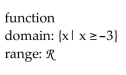
D) 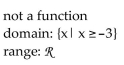
Correct Answer:
Verified
Q50: Determine if the relation illustrated is a
Q51: Determine whether the graph illustrated represents a
Q52: Evaluate the function for the indicated value.
-
Q53: Solve the problem.
-The formula for the circumference
Q54: Solve the problem.
-The formula for changing Celsius
Q56: Solve the problem.
-The formula for the area
Q57: Determine whether the graph illustrated represents a
Q58: Evaluate the function for the indicated value.
-
Q59: The graph below shows the percentage of
Q60: Determine whether the graph illustrated represents a
Unlock this Answer For Free Now!
View this answer and more for free by performing one of the following actions

Scan the QR code to install the App and get 2 free unlocks

Unlock quizzes for free by uploading documents