Use the REGRESSION feature on a graphing calculator.
-The use of bottled water in the United States has shown a steady increase in recent years. The table shows the annual per capita consumption for the years 1995 - 2001. 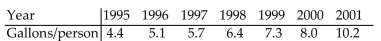 With x being the years since 1995, find the linear function that represents this data. Round your answer to two decimal
Places.
A) 
B) y = 0.89x + 4.07
C) 
D) y = 4.07x + 0.89
Correct Answer:
Verified
Q60: Solve the problem.
-A small company that makes
Q61: Use the REGRESSION feature on a graphing
Q62: Use the REGRESSION feature on a graphing
Q63: Use the REGRESSION feature on a graphing
Q64: Use the graph to find the average
Q66: Provide an appropriate response.
-Given two points s
Q67: Use the REGRESSION feature on a graphing
Q68: Solve the problem.
-The mathematical model C =
Q69: Solve the problem.
-Suppose the sales of a
Q70: Use the REGRESSION feature on a graphing
Unlock this Answer For Free Now!
View this answer and more for free by performing one of the following actions

Scan the QR code to install the App and get 2 free unlocks

Unlock quizzes for free by uploading documents