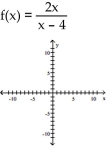
Use point-by-point plotting to sketch the graph of the equation.
-
A) 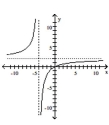
B) 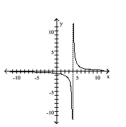
C) 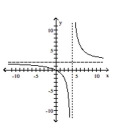
D) 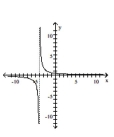
Correct Answer:
Verified
Q10: Determine whether the function is linear, constant,
Q11: Find the function value.
-Find f(-9) when )
Q12: Find the function value.
-Given that at
Q13: Determine whether the relation represents a function.
Q14: Determine whether the relation represents a function.
Q16: Use point-by-point plotting to sketch the graph
Q17: Provide an appropriate response.
-For f(t) = 3t
Q18: Find the function value. Q19: Determine whether the relation represents a function. Q20: The graph of a function f is
-![]()
Unlock this Answer For Free Now!
View this answer and more for free by performing one of the following actions

Scan the QR code to install the App and get 2 free unlocks

Unlock quizzes for free by uploading documents