The circle graph summarizes the results of a survey of the favorite movie category chosen by a group of adults. 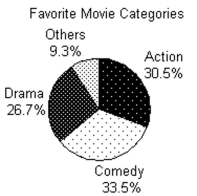
-2800 adults answer the survey. How many of the survey respondents said that they favor drama movies? Round to the nearest whole.
A) 2670 respondents
B) 748 respondents
C) 854 respondents
D) 260 respondents
Correct Answer:
Verified
Q116: The following circle graph displays Chris
Q117: The pictograph shows the number of bicycles
Q118: Fill in the blank with one
Q119: Fill in the blank with one
Q120: The bar graph shows the number of
Q122: Find the mean, median, and mode of
Q123: A new car dealership has taken an
Q124: Suppose that the numbers 1 through
Q125: Twenty teenagers were asked to give
Q126: Twenty teenagers were asked to give
Unlock this Answer For Free Now!
View this answer and more for free by performing one of the following actions

Scan the QR code to install the App and get 2 free unlocks

Unlock quizzes for free by uploading documents