The following schematic graph shows the result of two quantitative RT-PCR experiments. Total mRNA from two tissue samples (1 and 2) was isolated and subjected to RT-PCR using primers designed to amplify a tissue-specific gene. Added to the reaction was a fluorescent dye that fluoresces only when bound to double-stranded DNA. According to the graph, which tissue has a higher level of this mRNA? By how much? 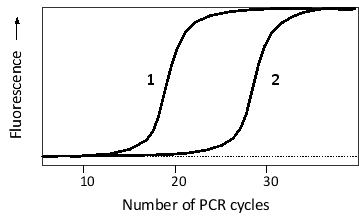
A) About 2-fold higher in tissue 1
B) About 1000-fold higher in tissue 1
C) About 2-fold higher in tissue 2
D) About 1000-fold higher in tissue 2
Correct Answer:
Verified
Q72: Which of the following can limit the
Q73: Which of the following methods provides the
Q74: The results of two sets of chromatin
Q75: In the following schematic graph, the fraction
Q76: A pool of five barcoded yeast mutants,
Q78: You have grown cultures of the yeast
Q79: In which of the following organisms is
Q80: Which of the following is NOT correct
Q81: Which equation better describes the steady-state concentration
Q82: Some feed-forward motifs are capable of generating
Unlock this Answer For Free Now!
View this answer and more for free by performing one of the following actions

Scan the QR code to install the App and get 2 free unlocks

Unlock quizzes for free by uploading documents