The figure given below shows the consumption functions of an economy.
Figure 9.4
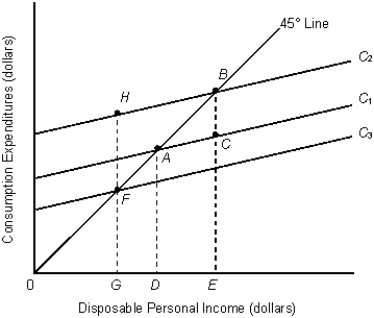
-Refer to Figure 9.4. Which of the following could explain a downward shift of the consumption function from C1 to C3?
A) An increase in household wealth
B) A decrease in the proportion of young people in the population
C) An increase in the size of the population
D) A decrease in consumer confidence
E) An autonomous decrease in saving
Correct Answer:
Verified
Q41: As household wealth increases, it will experience
Q48: Table 9.2 Q50: Which of the following statements concerning the Q51: The table given below reports the Q52: Which of the following variables do not Q54: The table given below reports the Q55: The consumer confidence index can be defined Q58: As a function of real GDP (real Q58: The figure given below shows the consumption Q59: _ is the primary determinant of consumption
Unlock this Answer For Free Now!
View this answer and more for free by performing one of the following actions

Scan the QR code to install the App and get 2 free unlocks

Unlock quizzes for free by uploading documents