The graph shows the depth of water W in a reservoir over a one-year period as a function of the number of days x since the beginning of the year. Estimate the average rate of change of W between x = 0 and x= 100? 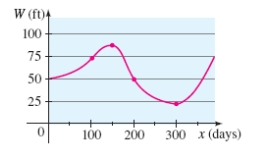
A)
B)
C)
D)
E) none of these
Correct Answer:
Verified
Q40: For the function given, find
Q41: Determine which viewing rectangle produces the
Q42: Use a graphing device to draw
Q43: Find the inverse of the function.
Q44: Determine whether the curve represents a graph
Q46: Determine whether or not the function
Q47: Use a graphing calculator to determine
Q48: Use a graphing calculator to find,
Q49: If an object is dropped from
Q50: Find the inverse of the function.
Unlock this Answer For Free Now!
View this answer and more for free by performing one of the following actions

Scan the QR code to install the App and get 2 free unlocks

Unlock quizzes for free by uploading documents