Essay
For the following data, construct a graph showing the probability distribution.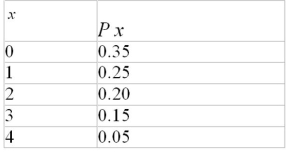
Correct Answer:
Verified
Related Questions
Q65: If a trial in an experiment has
Q66: Which of the following would be
Q67: The mean, variance, and standard deviation should
Q68: The _ is a distribution of a
Q69: A school is sending 9 children to
Q71: One of the requirements for a binomial
Q72: Draw a graph showing the probability distribution
Q73: A club consists of 4 male
Q74: In a survey, 65% of the voters
Q75: The figure below represents the probability distribution
Unlock this Answer For Free Now!
View this answer and more for free by performing one of the following actions

Scan the QR code to install the App and get 2 free unlocks

Unlock quizzes for free by uploading documents