Multiple Choice
Use the table to estimate the rate of change of y at the specified value of x.
-When exposed to ethylene gas, green bananas will ripen at an accelerated rate. The number of days for ripening becomes shorter for longer exposure times. Assume that the table below gives average ripening times of
Bananas for several different ethylene exposure times:
Plot the data and then find a line approximating the data. With the aid of this line, find the limit of the average ripening Time as the exposure time to ethylene approaches 0. Round your answer to the nearest tenth. 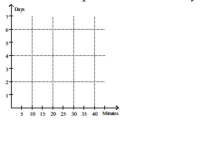
A) 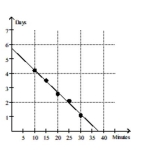
days
B) 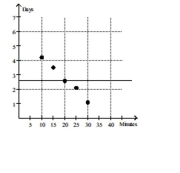
days
C) 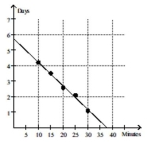
0.1 day
D) 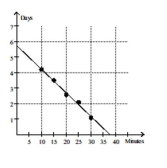
37.5 minutes
Correct Answer:
Verified
Related Questions
Q26: Q27: Find the limit. Q28: Use the graph to evaluate the Q29: Use the graph to evaluate the
-

