Graph 10-1 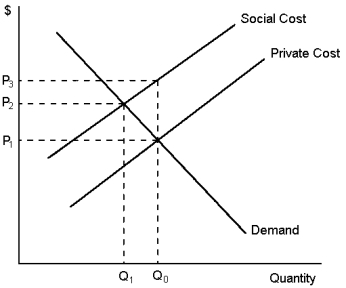
-Refer to Graph 10-1.In the figure shown, an optimal government policy would be a tax on production to the value of:
A) P₃ - P₁
B) P₃ - P₂
C) The value of the optimal tax cannot be measured
Correct Answer:
Verified
Q70: Graph 10-1 Q71: At any given quantity, cost to the Q72: Tom is very tall.When he goes to Q73: When the social cost of an externality Q74: If a particular market is associated with Q76: The height of the demand curve for Q77: An externality will: Q78: Suppose people plant flowering trees near their Q79: Graph 10-2 Q80: The height of the supply curve at![]()
A)usually be characterised as a![]()
Unlock this Answer For Free Now!
View this answer and more for free by performing one of the following actions

Scan the QR code to install the App and get 2 free unlocks

Unlock quizzes for free by uploading documents