Multiple Choice
Graph 13-6 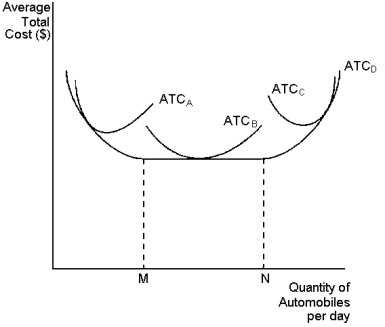 This graph depicts average total cost functions for a firm that produces automobiles.Use the graph to answer the following question(s) .
-Refer to Graph 13-6.Which curve represents the long-run average total cost?
A) ATCA
B) ATCB
C) ATCC
D) ATCD
Correct Answer:
Verified
Related Questions

