Graph 13-2 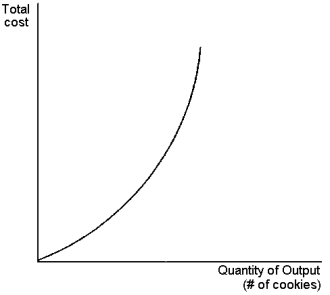 This graph depicts a total cost function for a firm that produces cookies.Use the graph to answer the following question(s) .
-Refer to Graph 13-2.Which of the statements below is most consistent with the shape of the total cost curve?
A) producing additional cookies is equally costly, regardless of how many cookies are already being produced
B) producing additional cookies becomes increasingly costly only when the number of cookies already being produced is large
C) producing an additional cookie is always more costly than producing the previous cookie
D) total production of cookies decreases with additional units of input
Correct Answer:
Verified
Q88: A sawmill processes logs into timber.Identify the
Q89: Jeremy, a small business owner, earns can
Q90: Fixed costs can be defined as costs
Q91: Average total cost is equal to:
A)average variable
Q92: If a firm mothballs a factory so
Q94: As the quantity produced increases:
A)average fixed cost
Q95: Which of the following costs do not
Q96: Average total cost equals:
A)change in total costs
Q97: Dave is majoring in computer information development
Q98: Suppose a firm increases output by one
Unlock this Answer For Free Now!
View this answer and more for free by performing one of the following actions

Scan the QR code to install the App and get 2 free unlocks

Unlock quizzes for free by uploading documents