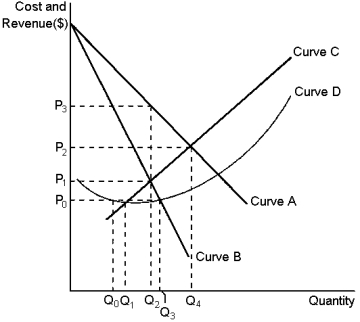
Graph 15-2  This graph reflects the cost and revenue structure for a monopoly firm.Use the graph to answer the following question(s) .
-Refer to Graph 15-2.If the monopoly firm is currently producing output at a level of Q₃, reducing output will always cause profit to:
A) increase as long as output is at least Q₂
B) increase as long as output is at least Q₁
C) remain unchanged
D) decrease
Correct Answer:
Verified
Q151: Graph 15-2 Q152: Supply curves tell us how much producers Q153: Graph 15-3 Q154: Graph 15-3 Q155: Graph 15-2 Q157: Graph 15-3 Q158: Graph 15-2 Q159: Along with the monopoly firms' cost curves, Q160: Graph 15-3 Q161: Graph 15-5 Unlock this Answer For Free Now! View this answer and more for free by performing one of the following actions Scan the QR code to install the App and get 2 free unlocks Unlock quizzes for free by uploading documents![]()
![]()
![]()
![]()
![]()
![]()
![]()
![]()

