Use the graph to answer the following question. 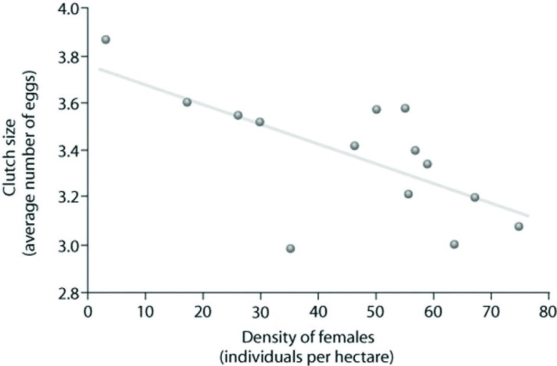 Which of the following claims can be best supported using the data?
A) Clutch size is always lowest at a density of about 35 females.
B) As female density increases, survivorship decreases.
C) Clutch size increases as female density increases.
D) Clutch size is inversely related to density.
Correct Answer:
Verified
Q50: Use the figure to answer the following
Q51: Use the figures to answer the following
Q52: Use the figure to answer the following
Q53: Which of the following is most consistent
Q54: Use the graph to answer the following
Q56: Use the graph to answer the following
Q57: Use the figure to answer the following
Q58: Which of the following is an energetic
Q59: In which of the following situations would
Q60: Which of the following statements regarding the
Unlock this Answer For Free Now!
View this answer and more for free by performing one of the following actions

Scan the QR code to install the App and get 2 free unlocks

Unlock quizzes for free by uploading documents