Use the graph to answer the following question. 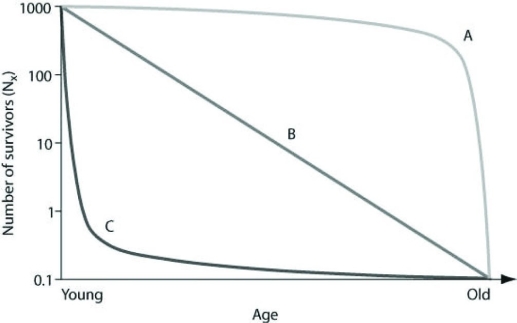 Which of the following examples are plausible explanations for a population that would produce curve A in the figure?
A) ongoing predation of pocket gophers throughout their lives
B) susceptibility of middle-aged humans to heart disease
C) higher predation success by wolves of older, slower elk
D) high seedling mortality in sunflowers
Correct Answer:
Verified
Q1: To measure the population of lake trout
Q3: Use the graph to answer the following
Q4: Which of the following techniques would most
Q5: Which of the following techniques would provide
Q6: In a field of corn or lettuce
Q7: Long-term studies of Belding's ground squirrels show
Q8: An ecologist recorded 12 white-tailed deer, Odocoileus
Q9: Use the graph to answer the following
Q10: Use the table to answer the following
Q11: Which of the following is a critical
Unlock this Answer For Free Now!
View this answer and more for free by performing one of the following actions

Scan the QR code to install the App and get 2 free unlocks

Unlock quizzes for free by uploading documents