Multiple Choice
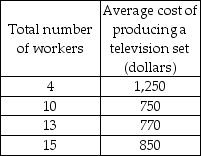
-Graphing the data in the above table with the number of workers on the horizontal axis and the average cost on the vertical axis, the graph would show
A) first a negative and then a positive relationship.
B) a horizontal line.
C) no relationship.
D) a linear relationship.
Correct Answer:
Verified
Related Questions
Q324: A graph measures y on the vertical

